tóng-àn:Change in Average Temperature With Fahrenheit.svg
跳至導覽
跳至搜尋


此 SVG 檔案的 PNG 預覽的大小:666 × 599 像素。 其他的 kái-sek-tō͘: 267 × 240 像素 | 533 × 480 像素 | 667 × 600 像素 | 853 × 768 像素 | 1,138 × 1,024 像素 | 960 × 864 像素.
全解析度 (SVG ùng-giông, chék-cháung: 960 × 864 chuông-só, ùng-giông duâi-nâung:236 KB)
|
|
這是對Wikimedia Commons引來的一份檔案。伊佇hia ê kì-su̍t-ia̍h頂面的資訊顯示對下底. |
Khài-iàu
| Soat-bêng |
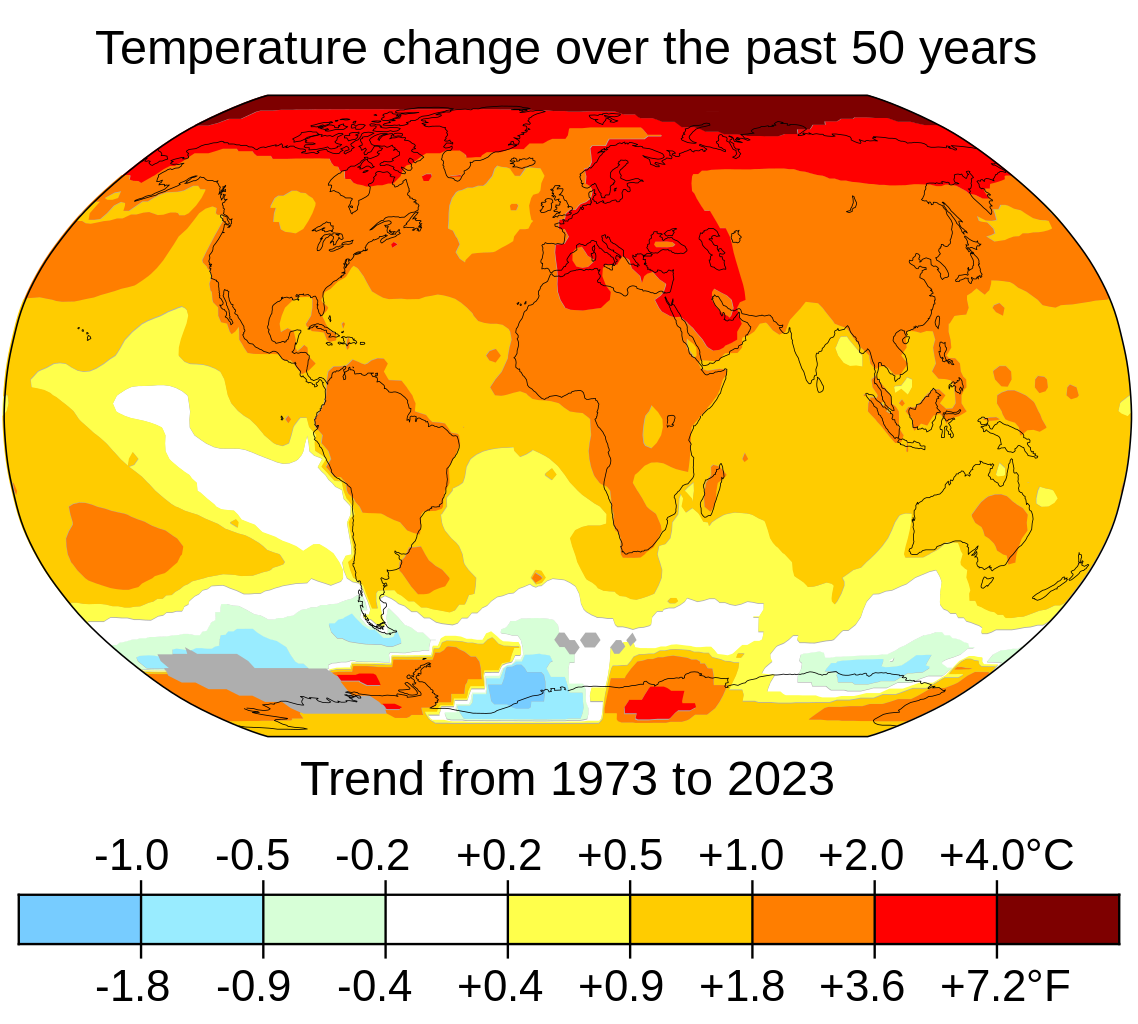
English: Surface air temperature changes to date have been most pronounced in northern latitudes and over land masses. The image uses the trend of annual averages to smooth out climate variability due to factors such as El Niño. The map is improved from the highest quality rendering that NASA’s Scientific Visualization Studio generates, with horizontal and vertical lines removed and with a more legible projection of Kavraiskiy VII. Grey areas in the image have insufficient data for rendering. For a version without Fahrenheit, see File:Change in Average Temperature.svg |
| Ji̍t-kî | |
| Chhut-chhù | https://data.giss.nasa.gov/gistemp/maps/index_v4.html |
| Chok-chiá | NASA’s Scientific Visualization Studio, Key and Title by uploader (Eric Fisk) |
| 其他版本 | Arabic (العربية), French |
Siū-khoân
我,本作品的著作權持有者,決定用以下授權條款發佈本作品:
此檔案採用創用CC 姓名標示-相同方式分享 4.0 國際授權條款。
- 你會使自由:
- 分享 – kho͘-pih, hoat-pò͘ kap thoân-pò͘ pún chok
- 重新修改 – kái-pian pún chok-phín
- Àn i-hā ê tiâu-kiāⁿ
- 標示名姓 – 您必須指名出正確的製作者,和提供授權條款的連結,以及表示是否有對內容上做出變更。您可以用任何合理的方式來行動,但不得以任何方式表明授權條款是對您許可或是由您所使用。
- 仝款方式方享 – Lí nā kái-tōng, piàn-khoán, he̍k-chiá kun-kù pún chok chhòng-chō, lí kaⁿ-taⁿ ē-tàng ēng kap pún chok kâng-khoán he̍k-chiá saⁿ-chhiūⁿ ê hí-khó lâi hoat-pò͘ chò--chhut-lâi ê chok-phín.
檔案歷史
揤日期/時間,看彼時陣的檔案.
| 日期/ 時間 | 細張圖 | 寸尺 | 用者 | 註解 | |
|---|---|---|---|---|---|
| 現在 | 2024年1月13日 (拜6) 11:34 | | 960 × 864(236 KB) | Tofeiku | File uploaded using svgtranslate tool (https://svgtranslate.toolforge.org/). Added translation for ms. |
影像連結
以下的頁連到這个影像: