tóng-àn:Global Temperature Anomaly.svg
跳至導覽
跳至搜尋

此 SVG 檔案的 PNG 預覽的大小:800 × 556 像素。 其他的 kái-sek-tō͘: 320 × 222 像素 | 640 × 444 像素 | 1,024 × 711 像素 | 1,280 × 889 像素 | 1,440 × 1,000 像素.
全解析度 (SVG ùng-giông, chék-cháung: 1,440 × 1,000 chuông-só, ùng-giông duâi-nâung:28 KB)
|
|
這是對Wikimedia Commons引來的一份檔案。伊佇hia ê kì-su̍t-ia̍h頂面的資訊顯示對下底. |
Khài-iàu
| Soat-bêng |
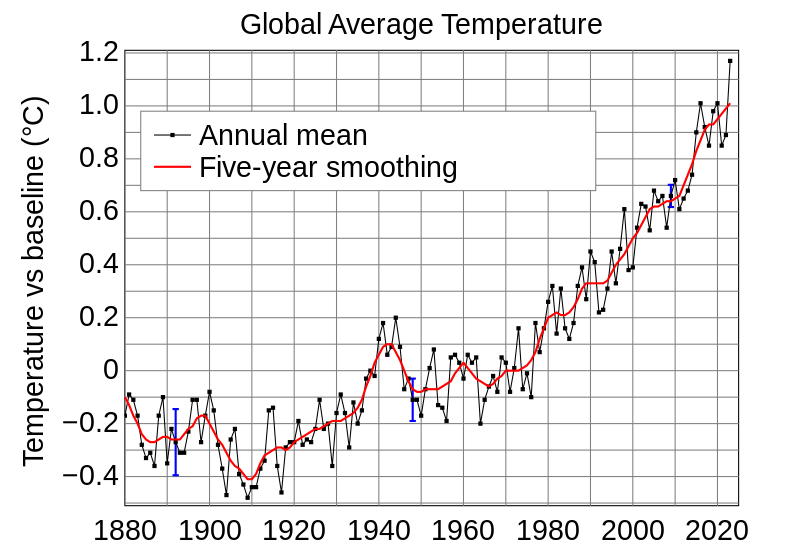
English: Land-ocean temperature index, 1880 to present, with base period 1951-1980. The solid black line is the global annual mean and the solid red line is the five-year lowess smooth. The blue uncertainty bars represents the total (LSAT and SST) annual uncertainty at a 95% confidence interval. [More information on the updated uncertainty model can be found here: Lenssen et al. (2019).]
The following translations are not updated: Čeština: Čárový graf globálního průměrného teplotního indexu Země-oceán, od roku 1880 do současnosti, k základnímu období 1951-1980. Černá čára je roční průměr a červená čára je pětiletý klouzavý průměr. [Toto je aktualizace Obr. 1A v Hansen et al. (2006).] Graf ukazuje celkový dlouhodobý trend oteplování dlouhodobý trend oteplování.
Español: Índice de la temperatura media global, desde 1880 hasta la actualidad, con el período base 1951-1980. La línea negra sólida es la media global anual y la línea roja sólida es una curva suavizada con una regresión local no paramétrica basada en un modelo k vecino más cercano. La función se evalúa utilizando una parte de los datos correspondiente a un rango de diez años de datos, lo que resulta en un suavizado en la práctica de aproximadamente cinco años. Las barras azules representan la incertidumbre (límite de confianza del 95%) para el caso de observaciones espaciales incompletas. Esto se basa en la Fig. 1A en Hansen et al. (2006) y la Fig. 9a en Hansen et al. (2010). Gráfico actualizado con datos hasta 2016 procedentes de https://data.giss.nasa.gov/gistemp/graphs/. El gráfico muestra una tendencia global de calentamiento a largo plazo. |
||
| Ji̍t-kî | |||
| Chhut-chhù | https://data.giss.nasa.gov/gistemp/graphs_v4/ | ||
| Chok-chiá | NASA Goddard Institute for Space Studies, changed | ||
| 其他版本 |
Derivative works of this file: Globalni teplotni odchylka cs.svg (czech) Derivative works of this file: Temperature Anomaly 1880-now NL.svg (dutch) |
||
| SVG開發 | |||
| Goân-sú-bé | SVG code
|
Siū-khoân
| 本作品由NASA創作,屬於公有領域。根據NASA的版權政策:“NASA的創作除非另有聲明否則不受版權保護。”(參見:Template:PD-USGov/zh,NASA版權政策或JPL圖像使用政策) | ||
 |
警告:
|
檔案歷史
揤日期/時間,看彼時陣的檔案.
| 日期/ 時間 | 細張圖 | 寸尺 | 用者 | 註解 | |
|---|---|---|---|---|---|
| 現在 | 2024年1月29日 (拜1) 07:51 | | 1,440 × 1,000(28 KB) | Habitator terrae | updated // Editing SVG source code using c:User:Rillke/SVGedit.js |
影像連結
以下的頁連到這个影像: